
Project Management Tools (PERT, Gantt, Run Charts)
Project Management tools are a great aid to project management activities such as planning the work according to objectives, assessing work and estimating resources, allocation of resources , assigning tasks, organizing the work, directing activities, tracking and monitoring progress and controlling project execution.
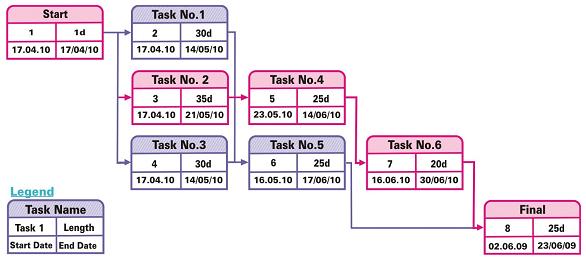
The Program Evaluation and Run Technique (PERT) chart is a model for project management. It is a tool designed to represent the tasks involved in a project and analyze the time required for completion during the project management life cycle. It also helps to identify the minimum time required to complete the project. It was developed to simplify the planning and scheduling of a project where all the details and durations of the activities are not known at the start itself. It is used especially in project where time scheduling is of more criticality than the budget factor.
The conventions used in a PERT are as follows. In the first version that is prepared, the Project Manager should number the events sequentially in multiple’s of 10s to allow insertion of events if required in between at a later stage. Two consecutive events are connected by activities represented by arrows. The events are represented in a logical sequence and no activity can commence till the preceding event is finished. The Project Manager or Planner decides which milestones constitute the events and their sequence. It may also have multiple pages with sub tasks.
The terminologies used are explained as follows. An event is a point that symbolizes the start or completion of one or more tasks. It consumes no time and resources. It is reached when all the activities preceding it are completed. An event may have predecessor (preceding event) or successor (succeeding event).
The predecessor and successor events may be outcome of one or more activity and has no intervening events. An activity is the actual performance of the task and uses time and resources. Implicitly it is the time, effort and resources required to move from one event to another. An activity can only complete if the event preceding it has occurred.
Optimistic time (O) is the minimum possible time required to complete a task under the theory that everything proceeds better than normal, Pessimistic time (P) is the maximum possible time required to complete a task under the theory that everything does not proceed as normal, Most likely time (M) assumes everything proceeds as normal, Expected time (TE) is the average time the task will require if the tasks had to be repeated in a number of occasions over an extensive period of time.
Float or slack is the buffer time that a task can be delayed without actually causing delay in schedule. Critical Path is the longest path taken from initial event to the terminating event. Critical activity is one that cannot accommodate float. Lead time is the time required for a predecessor event to be completed to allow sufficient time for the activities that must elapse before an explicit PERT event is reached for completion. Lag time is the earliest time by which a successor event can trail a specific PERT event.
Slack is a measure of the excess time and resources available to complete the event. Positive slack indicates ahead of schedule while negative slack indicates delay and zero slack indicates on schedule. Fast tracking is the performance of critical activities in parallel. Shortening the duration of critical activities is termed as crashing of critical path.
While implementing PERT the tasks that the project requires is determined along with the sequence. Once the activity, predecessor, time estimates, expected time is determined one can also draw a Gantt chart or network diagram. To create a PERT chart from an existing project plan in Microsoft Project, the PERT chart EXPERT toolbar button can be invoked.
Example of a PERT Chart (Critical Path is represented in light violet
color)
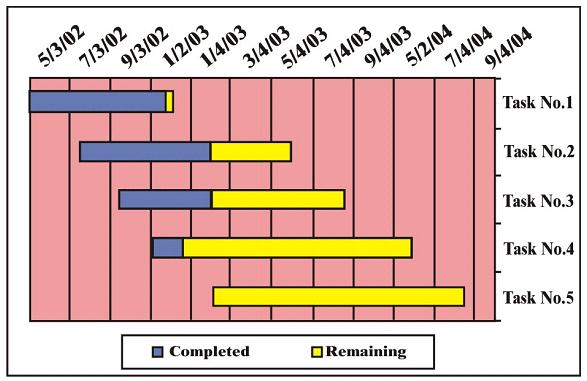
A Gantt chart is a type of bar chart depicting a project schedule. They have become a common practice for representing the phases and activities of a project work breakdown structure (WBS). As the project progresses, bars are shaded to show the completion status. Gantt charts are used when the steps of a project, its sequence and duration is known. Microsoft Project, a task planning program makes it possible to track and plan project timelines with a built in Gantt chart view.
A run chart is also known as run sequence plot. It is a graphical representation of observed data in a time sequence. The data generally represents the performance or output of a process. They are used to find anomalies in data that may help to detect factors that influence variability of a process. It is a simplest form of control chart as it depicts only the elementary measures of data over a period. These can also be created in Excel from the Ql Macros pull down menu.
All the above mentioned tools are popularly used to make task, team and project management easier. They address the needs of project management initial activities and simplify project communication.
| An insight into coordination and communication issues in Project Management | An Insight into Project Closure Activities | An Insight into Risk Breakdown Structure | An Insight into Work Breakdown Structure | Overview of Resource Management Techniques | Project Management Tools (PERT, Gantt, Run Charts) | Project Manager’s Perspective on Document Management System | Understanding Critical Practices in Project Management |
FREE Subscription
Stay Current With the Latest Trends & Developments Realted to Management. Signup for Our Newsletter and Receive New Articles Through Email
Note: We never rent, trade, or sell our email lists to anyone. We assure that your privacy is respected and protected.